Climate change is front page news. According to the UN’s International Panel on Climate Change, man-made climate change continues to be one of the biggest threats to earth. UN officials warn that we find ourselves in a “now or never” position if we want to limit global warming to 1.5 degrees between 2030 and the early 2050s. According to scientists, warming over 1.5 degrees will trigger catastrophic consequences – food insecurity, water scarcity, extinction of species, coastal flooding, extreme weather, and so on. It reads like the stuff of your favorite apocalypse movie.
As individuals, our role in addressing threats on this scale can be difficult to appreciate. As fleet managers, however, our control over transportation resources puts us in a unique position to make a significant and positive contribution to reduction efforts.
In this article, we’ll attempt to shed some light on the emissions challenge by addressing these questions:
- Where are we now? How much GHG does transportation contribute to overall US emissions? What policies and reduction targets are out there, and what do they mean for fleet?
- What can we do about it? What are some of the reduction opportunities at our disposal as fleet managers?
- How do we measure our success? What sources of data are available to us to track our fleet’s progress? How do we translate these data into emissions reporting?
 Where are we now?
Emissions from transportation
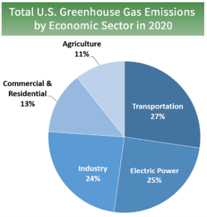
According to the EPA, transportation, as an economic center, accounts for largest portion (27%) of GHG emissions in the US. This contribution includes all modes of transportation – cars, trucks, trains, planes, and ships. It’s estimated that most of these emissions (57%) come from light-duty vehicles and buses. Fleet, of course, only puts some portion of these vehicles on the road, but with 645,000 vehicles in the federal government fleet, and millions more among state, local, and university fleets, ours is a large carbon footprint.
 GHG Reduction Targets
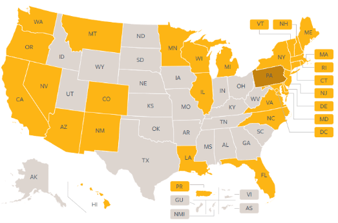
Governments at all levels, federal, state, and local, are taking action to address climate change through GHG emissions reduction targets and policy action. According to Berkeley’s California-China Climate Institute, 29 states and Puerto Rico have enacted near- and long-term targets and policies. Some states have more aggressive targets than others, and among the states represented, some have more significant implications for transportation activities.
The takeaway? If your fleet isn’t among the 60% of states operating with reduction targets and/or policy today, it’s likely that it will be soon. If you choose to begin emissions management voluntarily, you have an opportunity to get ahead of the game.
To learn about policies and targets for your state, click on the map at the right for additional details.
What can we do about it?
With insights from the EPA and our community of fleet managers, we’ve identified several opportunities to help your organization reduce its emissions contribution.
Get dirty in the Data
As the adage goes, “You can’t manage what you can’t measure.” To have an appreciation for what your fleet’s reduction opportunity looks like, you must know where you currently stand.
If you were asked these questions, how much trouble would you have finding answers?
- How many vehicles are in our fleet?
- What is the MPG rating for each vehicle?
- What percentage of the fleet are alternative fuel vehicles?
- How far and often do our vehicles travel?
- How often are our vehicles maintained?
- Are we best aligning our vehicles for our required tasks?
- Are we fully utilizing the vehicles we have today?
If you’re leveraging a fleet management information system, these data should be at your fingertips. With the ability to easily examine the characteristics of your vehicles and how they’re used, you can find opportunities to pull inefficient vehicles out of your pools, eliminate underutilized vehicles in your fleet, ensure vehicles are maintained for optimal performance, etc. Good data drives good decisions.
Switch fuels
The electric vehicle wave has begun, and it stands to reason that GHG is reduced by replacing fossil fuel-burning vehicles with EVs. Much has been written around best practices to electrify your fleet, but it suffices to say that an effective rollout starts well before parking EVs in your lot. As you plan for this move, you should consider:
- Your on-site and surrounding charging infrastructure
- Tax and grant benefits
- Driver adoption concerns, like range anxiety
- Availability of vehicle types for your work requirements
- Your fleet management information system’s support for EV data
Improve Operating Practices
There are countless opportunities to make your fleet more efficient. This could entail ensuring your drivers are using the most efficient routes as they conduct their work, making sure you stick to a rigid preventative maintenance schedule, or ensuring that available vehicles are properly aligned to the work for which they’re used. (Does that 12 mpg SUV need to drive one staff member to a conference in the neighboring state?) As noted above, good data is going to inform good operating practices, and many small improvements, in aggregate, can make a big difference.
 Reduce Travel Demand
Look around your office. How does it compare with how it looked, pre-pandemic? If yours is like many organizations, you may have permanently shifted toward hybrid work arrangements, a reduced office footprint, and a significant portion of your work tasks made remote using technology. In short, there are fewer people using office resources, including your fleet.
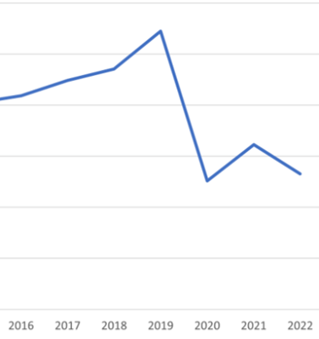
Even with the return to work and travel, for many organizations, vehicle demand remains well below pre-pandemic levels. Taking a macro-level view across fleet vehicle reservations among our clients gives us a keen appreciation for this trend. Following a peak in 2019 and the pandemic drop in 2020, we’re seeing a slow and significantly lower level of use in 2021 and 2022.
The message? Reducing travel demand reduces cars on the road. By partnering with leadership in other functions in your organization, you may identify tasks that don’t require travel or opportunities to limit the frequency of travel.
(Figure 1. at right: Reduction of Number of Trips During Covid)
Right-Size Your Fleet
Perhaps the most intuitive measure to reduce GHG emissions is to simply reduce the number of vehicles in your fleet and getting the right types of vehicles for the job. Having a firm understanding of your fleet’s utilization data is a great place to start. Vehicle utilization is a measure of the demand for your vehicles compared to some type of capacity or threshold. The value is often expressed as a percentage. For example, if 5 out of 10 vehicles in a fleet are used in each period, we might say our utilization rate is 5/10 or 50% for that period. Similarly, if we have a target fleet utilization rate of 1,000 miles driven in a month and we only travel 500 miles, we might say our fleet utilization rate is 500/1,000 or 50% for that month. Understanding utilization for each type of vehicle can help enable substantive change.
In our line of work, this is a scenario we’ve seen play out hundreds of times. A fleet manager has an inkling that her organization’s fleet is too large for the need. When we stand up our FMIS platform and gather data over a period of months or years, we often find that the gap between capacity and demand is far wider than suspected. In one case, we saw nearly a 75% percent reduction in the size of an organization’s fleet with no drivers denied access to vehicles. Right-sizing is an opportunity for a GHG and a cost reduction win, which presents an excellent opportunity to rally management to your cause!
How do we measure our success?
We’ve already addressed data’s important role in a fleet manager’s ability to find the right GHG emissions reduction opportunities. A good FMIS will provide the insight you need. But how do we bridge the gap between our functional improvements and GHG emissions? How do we quantify our good work?
The math for calculating GHG emissions is quite straightforward, and the EPA provides a number of ways to arrive at your reduction number:
- Tailpipe emissions per one gallon of fuel:
- CO2Emissions from a gallon of gasoline: 8,887 grams CO2/ gallon
- CO2Emissions from a gallon of diesel: 10,180 grams CO2/ gallon
- Tailpipe emissions per mile driven:
- The average passenger vehicle emits about 404 grams of CO2per mile
- Average annual emissions from a typical passenger vehicle:
- A typical passenger vehicle emits about 4.6 metric tons of carbon dioxide per year.
- This assumes the average gasoline vehicle on the road today has a fuel economy of about 22.0 miles per gallon and drives around 11,500 miles per year. Every gallon of gasoline burned creates about 8,887 grams of CO2.
There are many tools and resources like the rates provided by the EPA above available online to calculate carbon dioxide and other emissions from your fleet. By coupling your fleet data – miles driven, gallons of fuel consumed, vehicles removed from the road - to these rates, you can start to paint a picture of your organization’s emissions reduction effectiveness. Note: If reduction targets apply in your state, check with local policy to learn about specific requirements for applying these metrics.
What’s been your experience?
We’d love to learn more about how your organization is addressing GHG reduction targets and reporting, how your EV journey is progressing, and steps you’ve taken to help your fleet organization run most efficiently. If you’re interested in joining us as a guest blogger or would like to share your success story, please reach out!